Better display of Plant watering needs

It would be great to get a better understanding of watering needs for your plants by establish a baseline per zone and visually monitoring its moisture level.
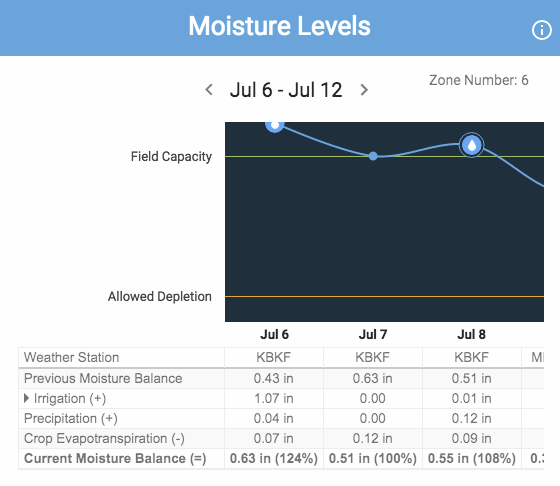
I found a moisture monitoring graph from a competitor's smart controller is very useful and self explanatory. I hope to see an equivalent analyses in RM soon.
-
Official comment

You do have the ability to go to Settings>System>About>"View Logs" and you can see the Program Coefficients recalculate every 6 hours.
At the same time I agree, a graphic showing water sense would go along way in understanding how the controller waters.
Thanks for your time and input.
Brandon M
RainMachineComment actions -

Hello Al,
Thank you for the feedback. We will try to implement this graph. We have nice graphs for each program (7 day / month / year) span and we can add soil moisture balance as well.
The problem is that each zone has a different soil moisture setting, so a program will display an aggregation of of all zone moisture. If not, we will have to implement a different graph for each zone and for each zone with its respective each program...
-
Thank you Andrei and Brandon for feedback.
Yes, I agree that a different graph for each zone would be great.
I'm not sure if you need to break down by each program; an aggregation by zone I think should be sufficient.
Although drill-down by zone/program would be nice but probably an overkill.
Thanks again
Al
Please sign in to leave a comment.
Comments
4 comments