Dashboard graphing bug?

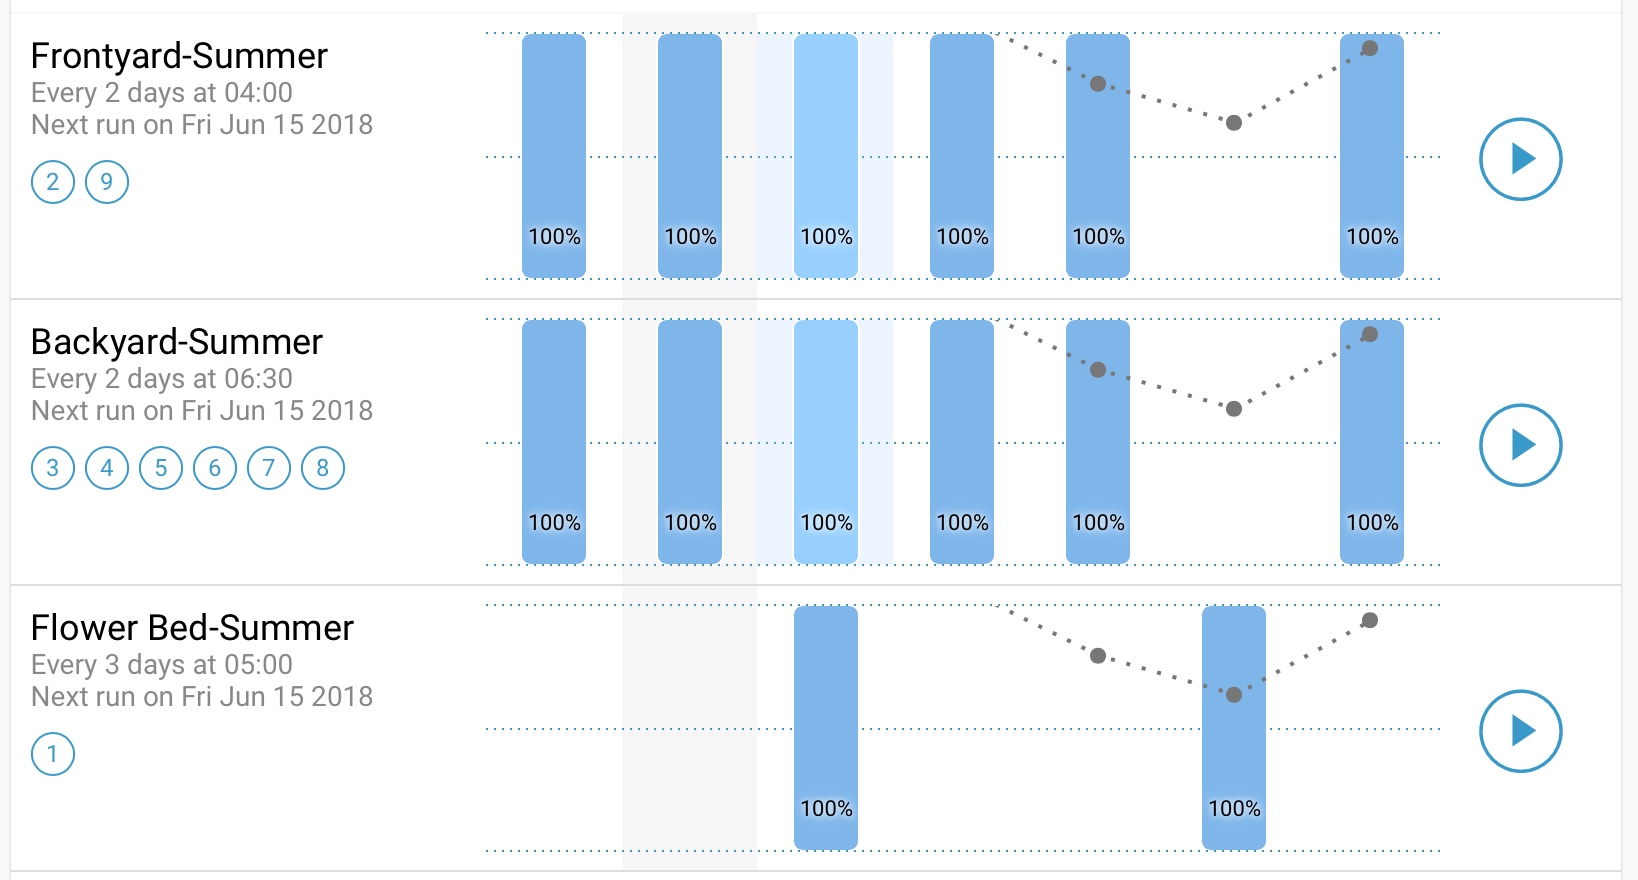
I have an HD-12 running beta firmware v4.0.927. On it I have three fixed-duration (non adaptive) programs. Two of programs are set to water every two days and the third is set to water every 3 days With these programs, the dashboard graph on both the web interface and via the IOS app (v4.5.105) will show a 100% water need on the days the program is set to water and 0% need on the days it will not water. This behavior is what I expect. I recently changed the starting date of both of the two 2-day programs to future date in order to shift their watering interval forward by one day. After doing so, the dashboard now shows 100% need every day of the week, despite the fact the programs are still actually running only every two days. See screen shot. I had modified the start date of the 1st two programs. See how the graph shows watering every day for the 1st two programs that I modified (seems like a bug to me) while the last one, which I did not modify the start date, continues to show 100% water need only on the days it will actually water.
-

This should fix itself at next simulation, the programs that had the start date changed still remain in simulation data cache but should clear themselves.
The issue is that we force a simulation of the program when frequency changes but not when start date change, something for dev team to improve.
Please sign in to leave a comment.
Comments
1 comment