Dashboard Precipitation Graphic (Yesterday) should reflect observed not forecast.

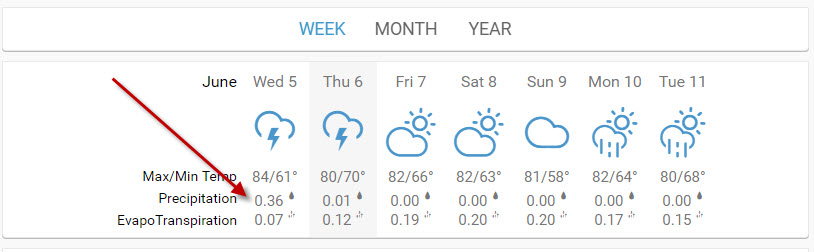
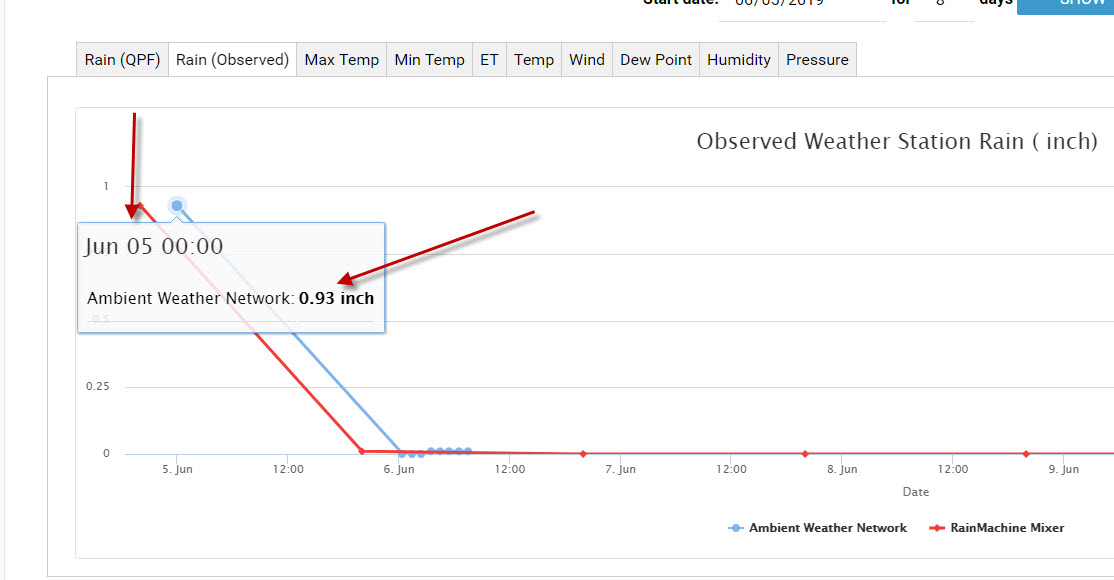
I have mentioned this before but wanted to put it out there again. The dashboard graphic with the 7 day i understand the precipitation value is coming from the 'forecast' values from NOAA (i am using). HOwever, i feel that the 'yesterday' value should not use a 'forecast' but rather the 'actual' data from my Ambient Weather Network parser (PWS). Again, my PWS from ambient weather is working properly and showing when you click in and see the actual rainfall, but the main dashboard for 'yesterday' which is no longer a 'forecast' should revert to a PWS if you have one enabled. See pictures below. Again, i understand the graph is using forecast data, but yesterday is no longer a forecast. Ironically during the rain event it jumped up to 0.67 even though we actually got 0.93 but then when i checked today, the 'yesterday data' dropped to 0.36. So i am hoping that rainmachine is using the PWS for actual calculations but it is very annoying to see the yesterday figure which is up in my face as the first thing i see not be accurate. So today is June 6, the rain event was june 5th for reference.
-
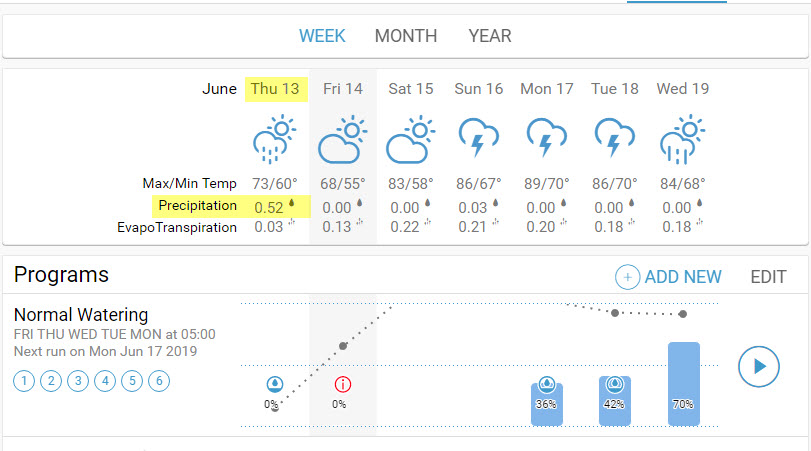
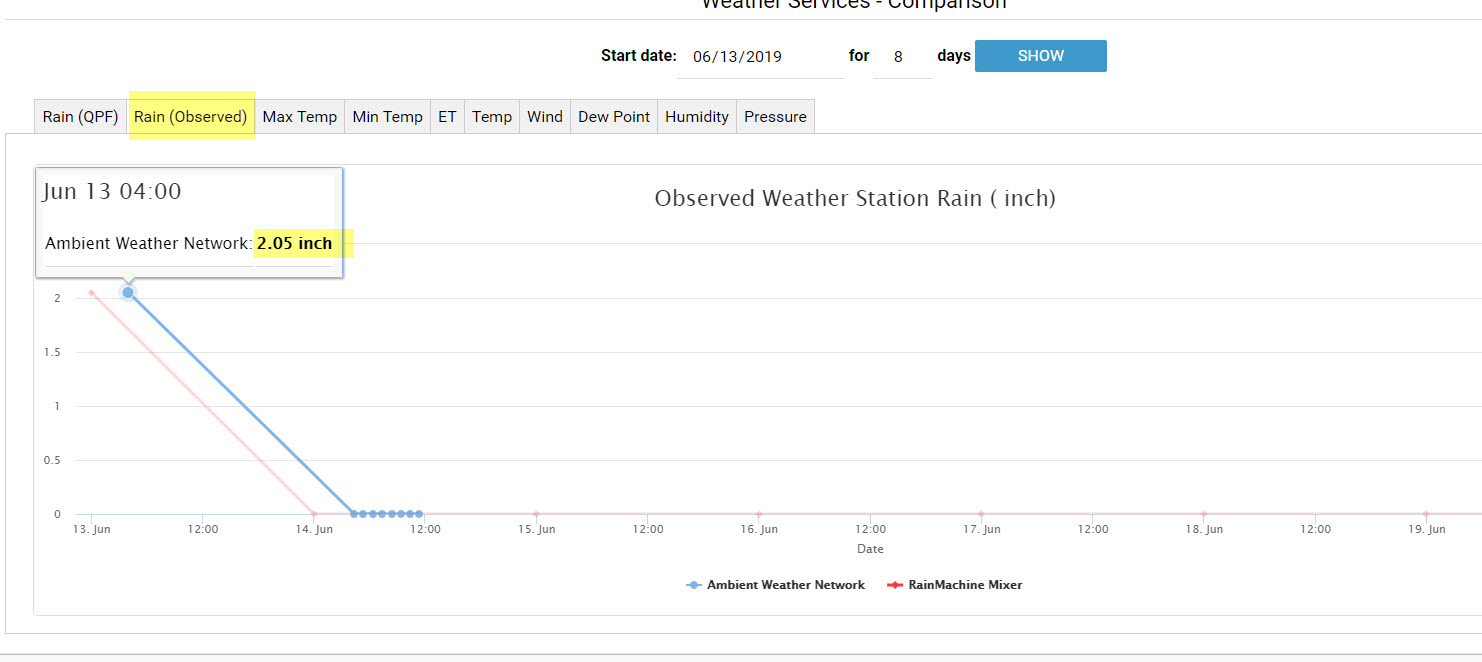
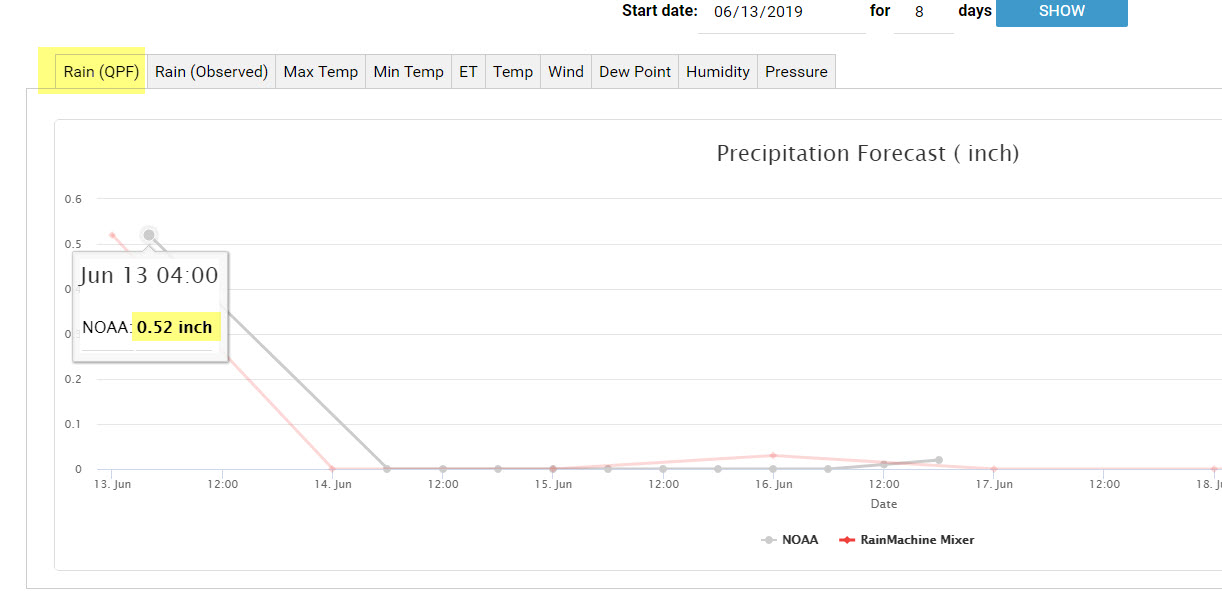
this is so frustrating, here is another example. Yesterday we had a huge rain event, we got 2.05" of rain for the 'day'. however 'today', the main dashboard is showing yesterday as only having 0.52" due to it gettings its info from the forecast of NOAA. again the 'yesterday' should go off of an actual reading whether that is from NOAA (i am being told that NOAA also has observed vs forecast data?), or if you have a PWS that should prioritize anyway for actual. Again yesterday would be actual observed.
this also worries me that rainmachine isn't using the proper info to update and then forecast proper watering times. is rainmachine thinking that yesterday was only 0.52 or 2.05? how do you tell?
today is friday for reference, yesterday was thursday.
Please sign in to leave a comment.
Comments
1 comment